1. Notification 설정하기
https://docs.oracle.com/en-us/iaas/Content/Notification/home.htm
Topic는 Subscription의 묶음이고 알람을 설정하는 단위이다. 그리고 Topic이름은 Tenancy전체에서 유일해야 한다.


Mail Subscription을 등록하면 Status는 Pending상태가 된다. 등록된 email로 확인요청메일이 발송되고 확인하면 사용가능 상태가 된다.

> Subscription으로 SMS등록(Monitoring, Service Connector Hub에서만 사용가능)

위에서 처럼 입력하면 Subscription의 State가 Pending상태가 되고 +15854496132 번으로 아래와 같이 문자가 온다.

문자를 받으면 'CONFIRM <Short Topic ID>'를 해외문자발송으로 보낸다.
(Short Topic ID는 문자로 전달이 되므로 Copy해서 전달하면 됨)
통신사마다 해외문자발송기준이 다를 수 있는데 Test해본 SK 텔레콤의 기준은 다음과 같다
* SK텔레콤
형식: 1579+국가번호+전화번호
문자 전송할 번호: 157915854496132
- 140k이내 건강 110
- 140k초과 건당 550
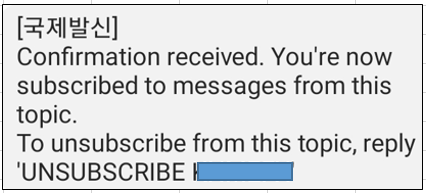
성공적으로 처리되면 다음과 같은 문자를 받게되고 Subscription의 State가 Active로 변경된다
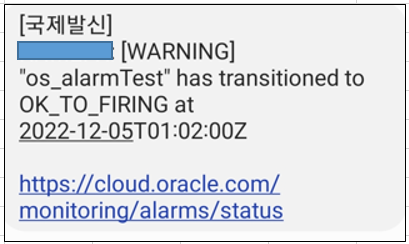
아래예시는 Monitoring Service에서 받은 SMS Alarm입니다.
> Subscription으로 Slack등록
WebHook URL을 등록한다. 아래 Link참조
2. Notification 사용하기
Notification은 OCI Service에 대한 상태변화 Event나 Monitoring 시 특정 Metric기준 만족시 Alarm을 받을 때 사용될 수 있다.
> Event Service 설정하기
Event Service는 OCI내 Resource에 대한 상태변화에 대한 Event을 Monitoring할 수 있다.

> Event Service에 대한 상세내용은 아래Link참조
https://docs.oracle.com/en-us/iaas/Content/Events/home.htm
> Monitoring Service - Alarm설정하기
OCI Resource사용을 Metrics기준으로 Monitoring하고 Metrics기준을 만족하는 경우 Notification을 통해서 Alarm을 발생시킬 수 있다
아래처럼 Metric이 조회되는 화면에서 바로 Alarm설정메뉴로 이동가능하고

Alarm Definitions메뉴에서 Create Alarm으로 Alarm을 등록할 수 있다.


> Trigger delay minutes: Alarm발생전 Trigger조건이 유지되어야 하는 시간
> Statistic
- Max/Min: 설정된 Interval내 가장 높은/낮은 사용율
- Mean: Interval별 사용율에 대한 평균치
- Count: Interval내 수집한 Metric Data 수
- Rate: second단위로 변경되는 사용율에 대한 Interval내 평균변동치
- P50, P90, P95, P99
> Statistic을 percentile로 사용예: P50, P90, P95, P99

WaitTIme: Internal내 session들의 평균WaitTIme
- P50: 0.0010
- P90: 0.1500
- P95: 0.2000
- P99: 0.8000 => 모든 세션들의 평균속도들이 가장느린 1%에 해당하는 속도.
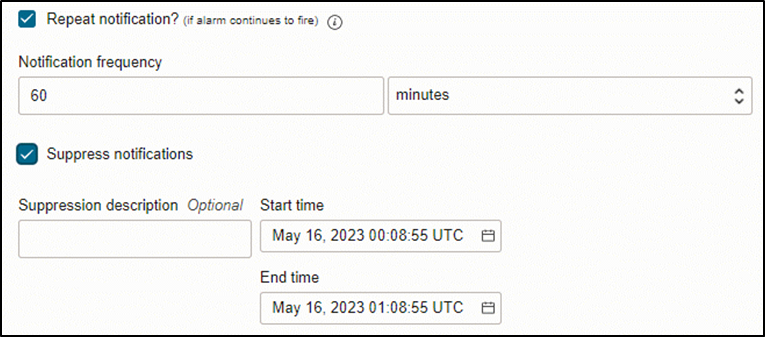
- Repeat notification: 알람이 발생할 수 있는 firing state에 있을 때 알람발송을 반복할지 여부
Notification frequency를 0으로 설정하면 이벤트기반 Alarm이 발생하게 됨
즉, (Event에 의한 반복 Notification이 아닌) Event가 있을때마다 Notification 발생
https://docs.oracle.com/en-us/iaas/Content/Monitoring/Tasks/update-alarm-event.htm
- Suppress notification: 특정기간동안 알람발송을 중지한다.
> Compute에 대한 주요 Alarm등록

> Notification 실패에 대한 알람등록가능

Alarm이 발생되면 해당 메뉴가 아래처럼 표시가된다


> Monitoring Service에 대한 상세내용은 아래Link참조
https://docs.oracle.com/en-us/iaas/Content/Monitoring/home.htm
※ OCI에서 제공하는 주요 모니터링 Metrics

https://docs.oracle.com/en-us/iaas/Content/Compute/References/computemetrics.htm - oci_computeagent
Compute Instance Metrics
The compute instance metrics help you measure activity level and throughput of compute instances. The metrics listed in the following table are available for any monitoring-enabled compute instance. To get these metrics, enable monitoring on the instance.
docs.oracle.com
https://docs.oracle.com/en-us/iaas/Content/Network/Reference/vnicmetrics.htm#VNIC_Metrics - oci_vcn
VNIC Metrics
For every 1-minute interval, the Networking service posts one raw data point to the Monitoring service. The Monitoring service charts show data points at 1-minute, 5-minute, 1-hour (60-minute), and 1-day intervals. Supported values for interval depend on t
docs.oracle.com
https://docs.oracle.com/en-us/iaas/Content/Block/References/volumemetrics.htm - oci_blockstore
Block Volume Metrics
The Block Volume service emits metrics to help you track volume replication operations. The metric emitted is determined by the resource type, either a volume resource or a replica resource. Each metric includes the following dimension : RESOURCEID The OC
docs.oracle.com
https://docs.oracle.com/en-us/iaas/Content/Network/Reference/ipsecmetrics2.htm - oci_vpn
Site-to-Site VPN Metrics
The available metrics help you determine quickly if your Site-to-Site VPN is up, how much data is flowing over the connection, and if packets are being dropped for unexpected errors. Site-to-Site VPN includes these resources: An IPSec connection, which you
docs.oracle.com
- oci_autonomous_database
Autonomous Database on Dedicated Exadata Infrastructure
You can monitor the health, capacity, and performance of your Autonomous Databases with metrics, alarms, and notifications. You can use Oracle Cloud Infrastructure console or Monitoring APIs to view metrics.
docs.oracle.com
3. Health Check
서비스 중인 Application의 서비스 제공여부를 체크해 볼 수 있는 기능

> Helth Check를 알람에 설정하기

- Trigger delay minutes: Event발생 후 Trigger가 발생할 때까지의 Delay시간
4. Infrastructure Maintenance에 대한 알람등록하기
아래 Link 1번 참고
작성자: 손창호(primelyson@gmail.com) / Cloud Engineer, 정보시스템감리사, DAP, PIA
개인의 시간을 할애하여 작성된 글로서 글의 내용에 오류가 있을 수 있으며, 글 속의 의견은 개인적인 의견입니다.
'7. 모니터링 Monitoring' 카테고리의 다른 글
| Service Log를 Logging Analytics로 분석하기 (0) | 2022.07.01 |
|---|---|
| Audit (0) | 2022.07.01 |
| Custom Log (0) | 2022.06.13 |
| 대시보드 모니터링 Dashboard - Monitoring (0) | 2022.05.09 |
| 비용 관리 Cost Management (0) | 2022.04.28 |


댓글